Game theory of vaccination
How unreasonable is it to not vaccinate your children?
I ask this not as a rhetorical question, but as a mathematical one. How do we describe, mathematically, the benefits and risks of vaccination? What does this description tell us about the reasonableness (or unreasonableness) of not vaccinating?
These days, most of the debate about vaccination is centered around questions of misinformation, misunderstanding, delusion, and conspiracy. But all this shouting obscures an interesting and very real mathematical question.
So let’s consider the dilemma of a perfectly well-informed and perfectly rational person faced with the decision of whether to vaccinate their child against some particular disease. Making this decision involves weighing issues of risk and reward, and thinking about selfishness and altruism.
Luckily for us, there is an entire mathematical science devoted to addressing these kinds of questions: the science of Game Theory.
In this post I want to take a game-theoretical look at the problem of vaccination. In particular, we’ll ask the questions: under what conditions is a disease dangerous enough that you should vaccinate? And is doing what’s best for your child different from doing what’s best for society as a whole?
Risk and Reward
The key idea in this analysis is as follows. When you vaccinate your child, you provide them with the benefit of immunity against a disease that they might encounter in the future. This benefit is potentially enormous, and life-saving.
However, if your child lives in a population where nearly everyone already has the vaccine, then the benefit of the vaccine to your child is greatly reduced. After all, if everyone around is effectively immune to the disease already, then the group’s “herd immunity” will greatly reduce the chance that your child ever gets exposed to the disease in the first place.
You might therefore be tempted to decide that even a very small risk inherent in the vaccine would make it not worthwhile. And, certainly, such risks do exist. For example, there is a very small chance that your child could have a serious allergic reaction to the vaccine, and this reaction could lead to things like deafness or permanent brain damage. If your child is already getting “herd immunity” from everyone else’s vaccination anyway, then why risk it?
Let’s consider this question in two steps. First, we’ll ask what is the optimal vaccination rate. This is the rate that maximizes the safety and well-being of the whole population. Then, we’ll ask the more pointed question: which is the decision that is best for your child alone, given that as a parent your concern is to minimize the chance of harm to your child, and not to the world as a whole.
Let’s discuss these ideas in a completely theoretical sense first, and then we’ll put some numbers to them to see how the real world compares to the theoretical ideal.
The optimal behavior
Imagine, first, a population where everyone is vaccinated against a particular disease except for some fraction x of non-vaccinators. Now suppose that a randomly-chosen individual gets exposed to the disease.
If the vaccine is highly effective, then the chance that this person will contract the disease is the same as the chance that they are not vaccinated: x. In the event that this person does contract the disease, then they will expose some number n of additional people to the disease. This wave of second-hand exposures will lead to a wave of third-hand exposures, and so on. At each wave there is a multiplication by n in the number of potentially exposed people, and a (hopefully small) probability x of the disease being communicated.
You can diagram the spread of the disease something like this:
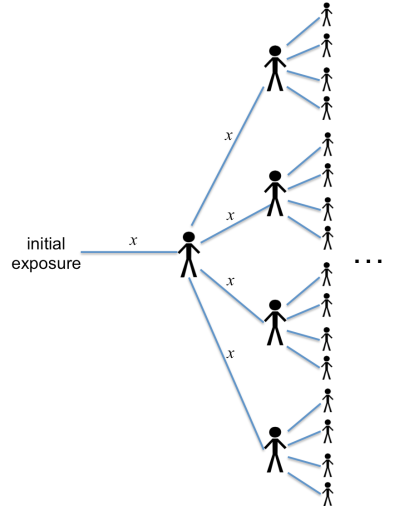
This picture illustrates the case n = 4 (i.e., every infected person exposes an average of four other people). Each branch labeled “x” shows the probability of the disease being spread at that step.
If you add up the expected number of infected people, you’ll get


This last equation already suggests an important conclusion. Notice that if the rate of non-vaccination, x, gets large enough that 
In other words, if 
If this condition is met, then there is no question about vaccinating. A population that is susceptible to epidemics is one where you need to get vaccinated. End of story.
But let’s assume that you live somewhere where this particular disease doesn’t cause epidemics anymore. (Like, say, mumps in the USA – more on this example below.) An absence of epidemics generally implies 
Let’s say that every so often someone within the population is exposed to the disease. We’ll call this the rate of exposure, E, which can be defined as the number of initial exposures in the population per year. Combining this rate with the equation above means that

people will be infected per year.
This rate of disease-induced sickness should be compared with the rate of vaccine-induced sickness. If a fraction x of people are not vaccinated, that means that 


What this all means is that there are

vaccine-induced illnesses in the population every year.
(If you’re getting lost keeping track of all these variable names, don’t worry. Only two will matter in the end.)
From a population-wide standpoint, the optimal rate of vaccination is the one that minimizes the total amount of illness in the population per year:

Taking the derivative 


Here, the variable 

You can think of
(The variable
You can notice two things about the theoretically optimal non-vaccination rate, equation (1). First, the non-vaccination rate x is always smaller than 
Second, the rate of non-vaccination declines as the relative disease risk 
Rational self-interested behavior
The analysis in the previous section was only concerned with the question “what is best for the world at large?” If you are asking the more limited question “what is best for my child?”, then the answer is slightly different. For this decision, you only need to weigh the probability of getting the disease against the probability of getting sick from the vaccine. The risk of conveying the illness to others doesn’t enter the analysis.
To figure out the probability of your child getting the disease, you can repeat a similar analysis to the one above: drawing out the tree of possibilities for each instance of infection. That analysis looks a lot like the picture above, except that there is one possible branch (representing your unvaccinated child) that has no protection against infection, and the rate of contracting the disease upon exposure is 

The corresponding probability of your child being infected after a given initial exposure is therefore
![\frac{1}{N} \sum_{i = 1}^{\infty} (x n)^i = 1/[n(1-xn)]](https://s0.wp.com/latex.php?latex=%5Cfrac%7B1%7D%7BN%7D+%5Csum_%7Bi+%3D+1%7D%5E%7B%5Cinfty%7D+%28x+n%29%5Ei+%3D+1%2F%5Bn%281-xn%29%5D&bg=ffffff&fg=333333&s=0&c=20201002)
Since we have assumed that there are 
![E T/[N(1-xn)]](https://s0.wp.com/latex.php?latex=E+T%2F%5BN%281-xn%29%5D&bg=ffffff&fg=333333&s=0&c=20201002)
As a rational, self-interested parent, you should only vaccinate if this probability is greater than the probability
![E T/[N (1-xn)] > v](https://s0.wp.com/latex.php?latex=E+T%2F%5BN+%281-xn%29%5D+%3E+v&bg=ffffff&fg=333333&s=0&c=20201002)
You can call this condition a “Nash equilibrium”, using the language of game theory. When the inequality is satisfied, vaccination is a good idea. When it is not satisfied, vaccination is a bad idea, and self-interested individuals will not do it. As a consequence, a population of rational, self-interested people will settle into a situation where the inequality is just barely satisfied, which is equivalent to
This result actually has a lot of features in common with the optimal result for vaccination. For one thing, it implies that you should always vaccinate if 
More pointedly, however, you should also always vaccinate any time the relative risk of the disease,
In this sense the self-interested behavior is pretty closely aligned with the globally optimal behavior. The disagreement between them is a relatively mild quantitative one, and exists only when the relative disease risk 
Confident self-interested behavior
Now, it’s possible that you don’t accept one of the central premises of the analysis in the preceding section. I assumed above that an essentially healthy population is subject to occasional, randomly-occurring moments of “initial exposure”. In such moments it was assumed that a person is chosen at random to be exposed to the disease. Presumably this exposure has to do with either traveling to a foreign location where the disease is endemic, or with meeting someone who has just come from such a location.
You might think, however, that it is very unlikely that your child will ever be such a “primary exposure point”. Perhaps you know that your child is very unlikely to travel to any place where the disease is endemic, or to meet anyone who has come directly from such a place. If you have this kind of confidence, then the calculation changes a bit. Essentially, one needs to remove the probability of being the initial exposure point from the analysis above.
Under these assumptions, the resulting risk of contracting the disease becomes ![E T x n/[N(1-xn)]](https://s0.wp.com/latex.php?latex=E+T+x+n%2F%5BN%281-xn%29%5D&bg=ffffff&fg=333333&s=0&c=20201002)

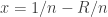
![x = 1/[n(1+R)]](https://s0.wp.com/latex.php?latex=x+%3D+1%2F%5Bn%281%2BR%29%5D&bg=ffffff&fg=333333&s=0&c=20201002)
This equation satisfies the same “no epidemics” rule, but it is qualitatively different in the way it responds to increased disease risk
In other words, a population of “confident” self-interested individuals will always have some finite fraction
The three possible non-vaccination rates can be illustrated like this:

Real data: the MMR vaccine
The above discussion was completely theoretical: it outlined the ideal rate of vaccination according to a range of hypothetical decision-making criteria. Now let’s look at where the present-day USA falls among these hypotheticals. As a case-study, I’ll look at one of the more hotly-discussed vaccines: the measles-mumps-rubella (MMR) vaccine.
First of all, it is sadly necessary for me to remind people that there is absolutely no evidence for any link between MMR (or any other vaccine) and autism.
But that’s not to say that there is zero risk inherent in the MMR vaccine. In very rare cases, a vaccination can lead directly to a runaway allergic reaction, which can produce seizures, deafness, permanent brain damage, or other long-term effects. The CDC estimates these side effects to occur in at most one person per million MMR vaccinations. (In terms of the variables above, this means 
Compare this to the combined rate of measles, mumps, and rubella infections in the USA. The average rate of occurrence of these diseases during the past five years has been something like 1200 cases per year. Given that the MMR vaccine coverage in the United States is about 92%, this implies a rate of “initial exposure” of something like 
Of course, most people who contract measles, mumps, or rubella recover without any permanent side effects – they just have to suffer through an unpleasant illness for a few weeks. So to make a fair comparison, I’ll discount the exposure rate by a factor that approximates only the risk of acquiring a permanent disability due to the disease. For example, about 0.3% of measles cases are fatal. For mumps, about 10% of cases lead to meningitis, and something like 20% of those result in permanent disability (such as hearing loss, epilepsy, learning disability, and behavioral problems). Finally, the main danger of rubella is associated with congenital rubella syndrome, a terribly sad condition that affects infants whose mothers contract rubella during the middle trimester of pregnancy.
Even discounting this last one, a low-side estimate is that about 1.7% of people who get measles, mumps, or rubella will suffer some form of permanent disability as a consequence. So I’ll discount the “primary exposure” rate to only 
This number should be compared to the rate of vaccine-induced disability, which is something like 

Pause for a moment: this is a large number.
It implies that the risk associated with actually contracting measles, mumps, or rubella is at least 70 times larger than the risk from the vaccine.
This is true even with the relatively low incidence of cases in the US, and even with the relatively robust “herd immunity” produced by our 92% vaccine coverage. 
Given this large value of relative risk, we can safely conclude the current non-vaccination rate in the USA, 
Even the “confident self-interested” person, who believes that their child has no chance of being a point of primary exposure to the disease, will agree that the current vaccine coverage is too low to justify non-vaccination. Only at
Conclusion
I went through this analysis because I believe that, at a theoretical level, there is room for a conversation about weighing the risks of vaccination against the benefits. It is true that in a relatively healthy population that is herd-immunized against outbreaks, a vaccine’s side effects can be a more real risk than the disease itself. It is also worth understanding that in such situations, the incentives of the altruist (who wants to minimize the risk to the world at large) are not perfectly aligned with the incentives of individual parents (who want to minimize the risk to their own child).
But in the present-day USA, these choices do not appear to be at all difficult, and there are no thorny theoretical issues to worry about. Our vaccines remain safe enough, and the disease risks remain large enough, that any level of rational quantitative thinking, self-interested or altruistic, leads to the same conclusion.
Vaccinate your kids.
(Unless, of course, you know that your child has some pre-existing medical condition that makes vaccination unsafe.)

Thanks for this very nice analysis.
You’re welcome! I hope that people find it useful or informative.
Outstanding piece of work, sir!
Thanks!
Amazing idea, get it publish sir.
I actually tried to get it published on some popular website, but it was apparently too much math for prime-time.
I am wondering if you are basing mortality and disability on statistics that are current and based on those countries where they still have sizable outbreaks of these illnesses, or if you went to the cdc website, and looked at historical US numbers for mortality and disability?
http://www.cdc.gov/measles/about/history.html
According to the CDC website, in the United States, in the decade prior to widespread vaccination for measles, somewhere between 3 and 4 million people per year contracted the disease, and there were an estimated 400 to 500 deaths per year from measles complications. Now, I am not a math gal, but that is not a .3 percent mortality. You can’t use mortality and complication statistics from countries where they don’t have the level of healthcare and sanitation that we do. Poverty and malnutrition create much worse outcomes for those individuals.
Further, while I respect what you are doing here, the data on vaccine related deaths and disability is suspect, because it entirely relies on doctors to report, or parents or victims to report to the VAERS database, which they may or may not do, because they may or may not attribute something to the vaccine as opposed to some other cause, like SIDS for example.
Also, I think that the outlook would be different for different vaccines. Let’s say the chicken pox vaccine. We all lived through it, and I don’t know a soul who suffered any significant harm from it, which is purely anecdotal, yet you can see where I might have some reluctance to vaccinate for it when it seems that it is being pushed by the big pharmaceutical companies as if chicken pox is suddenly a dreadful affliction on humanity?
I don’t want to bore you, but I will say that one of the mistakes that people such as yourself often make is believing that people such as myself have no logical basis for believing what they do, and have not or are incapable of looking at something in a dispassionate and analytical way. Because everyone thinks that if you skipped a vaccine, you must be listening to Jenny McCarthy. Given that those who do not or selectively vaccinate are generally well educated, you can be certain that a cost benefit analysis was done
So I respectfully submit that while your statistics are excellent, your data you are drawing from is not.
Hi Lee,
Thanks for your comment. All my statistics come from CDC data for the USA in the most recent years available (2012 and later). The links are embedded above.
It is certainly not my intention to claim that non-vaccinators are being illogical or irrational. Indeed, part of the purpose of this article is to make clear that the question of whether or not to vaccinate can be somewhat subtle. I personally wasn’t sure what the right answer was (from the parents’ perspective) until I did an actual quantitative analysis.
As I see it, though, the analysis has a pretty clear conclusion: vaccination is at least 70 times more likely to help your child than to harm them.
The numbers you are using are mortality from measles on a world wide basis. For the reasons I stated, and if you check the link I included, if we in the US were to hypothetically stop vaccinating for measles entirely, re-introduce it, the mortality HERE in the US would be significantly less than the mortality that is stated on the CDC website which includes poverty stricken countries with poor sanitation, poor nutrition, and poor healthcare options. Further, the VAERS system has an inherent flaw, in that it is a self reporting system. Self reporting systems are cheap and easy but they carry the risk of under reporting.
I don’t think that you specifically are accusing anyone of being irrational, I am simply pointing out that the situation you are looking at is more nuanced than your math has taken into account.
The 0.3% fatality rate for USA 1987-2000 apparently comes from table 2 in https://academic.oup.com/jid/article-lookup/doi/10.1086/377712. While the measle death case statistics will be fairly trustworthy, on the other hand the number of measle disease cases is often underreported, as the WHO has admitted. E.g., before vaccination started in the USA, only about 400 000 measle cases per year were officially reported, while probably about 4 million cases per year actually took place.
If we look at published reports about measle deaths in developed countries, many who die, or those who are in a high danger of dying from measles, are infants younger than 1 year who can’t be vaccinated, and people with pre-exisiting immunedefects, or other diseases. This will be even more true for developing countries, e.g. for the many persons with existing HIV infections. Also, many cases of the always deadly subacute sclerosing panencephalitis (SSPE) result from an measle infection at an age <1 year, before vaccination is possible.
This circumstances mean, that in developed countries with an existing low measles rate, children from wealthy family without known immunedefects have a very low risc to die from measles if they stay unvaccinated.
On the other hand, if there are exisiting risc factors for a child, like a poor family background, many siblings, existing immunedefects, etc., vaccination makes much more sense from an egoistic point of view.
So for quite an number of people, in particular wealthy people, and people in wealthy countries, it makes egoisitically sense to choose not to vaccinate their children or themself. But this means that the political elimination goals, set by the WHO and national government, can't be achieved in the near future, without either massive promotion campaigns or forced vaccination laws. At the moment we can see both: the mainstream media are brought into line to promote vaccination, and a growing number of countries, like California or Italy, adopt forced vaccination laws.
But one needs to take the analysis a step further, to incorporate interactive rationality. Suppose that R is less than 1. Then the conclusion of the article would be that it is rational not to vaccinate your child. However, if *everyone* is using this rationale, then every child will not be vaccinated — which will raise R to R greater than 1, in which case you definitely should vaccinate your child, and even do so before others might start non-vaccinating. In other words, one needs to take into account second-order decisions about everyone’s first order decisions, and then continue into higher and higher orders.
Hello, I returned to your still interesting article on occassion of a recent mandatory vaccination debate in Germany. While I disagree with several assumptions and results, I should admit studying the article helped me to further understand the topic of vaccination games.
First we should remember that mumps-infections don’t cause measles damage and vice versa, same with rubella, even if a common vaccine is used against them. So we should look at the diseases separately.
According to the source https://academic.oup.com/jid/article/189/Supplement_1/S4/823958 cited by Wikipedia, 0.3% measles fatality refers to the years 1987-2000. On the other hand https://academic.oup.com/ije/article/38/1/192/696766 gives an estimate of 0.05% for developed countrie. I assume 0.1% is an accepted estimate of magnitude for long-term effects including death and disability by measles.
The CDC page https://web.archive.org/web/20160211185233/https://www.cdc.gov/vaccines/vac-gen/side-effects.htm#mmr didn’t say that it’s an allergic reaction to measles vaccine which can cause “seizures, deafness, permanent brain damage, or other long-term effects”. Seizures are usually not a long-term effect. The problem of estimating measles vaccine risk is discussed further e.g. on https://books.google.de/books?id=Hyn0CAAAQBAJ&pg=PA67. Still, 1:1000000 seems an accepted estimate for long-term effects of MMR-vaccine. However MMR-vaccination includes two doses, so it seems we should consider 2:1000000 as risk of the overall vaccination.
Wikipedia doesn’t says that about 10% of mumps cases lead to meningitis, but rather the other way around: “before vaccination, about 10% of cases of aseptic meningitis were due to mumps”. However even if 10% is about the risk that a mumps case will lead to meningitis, this is a viral meningitis. While “permanent disability (such as hearing loss, epilepsy, learning disability, and behavioral problems)” is caused by bacterial meningitis, not associated with mumps.
While mumps can cause long-term damage in particular in adolescents and adults, measles includes a higher risk than mumps of brain damage and death, in particular for infants, adults and old people. Therefore, in the remainder of this post I only look at measles.
For USA we can assume life expectancy of about 80 years.
According to the formal model, average age of disease is 1/2*(life expectancy), but in reality measles occure earlier in life: “Median patient age was 5 years (interquartile range = 1 year to 18.5 years); 25 (4%) patients were aged <6 months, 68 (10%) 6–11 months, 76 (11%) 12–15 months, 167 (24%) 16 months–4 years, 203 (29%) 5–19 years, 138 (20%) 20–49 years, and 27 (4%) ≥50 years" https://www.cdc.gov/mmwr/volumes/68/wr/mm6817e1.htm
From these numbers we can estimate average age of measles at about 15 years; which means long term-effects will impair T=65 years of remaining lifetime.
US population is about N=327 million.
From 2010 till 2019 there have been 307 measles cases per year on the average.
I don't right understand how a number of 1200 measle-mumps- and rubella cases and non-MMR-vaccination rate of x=8% means an initial exposure of E=15000, since we also have to take into account cases created through further follow up infections which are represented by the factor 1/(1-nx).
Assuming a vaccine coverage of 92% while herd immunity apparently holds in the USA, we know that the number n can't exceed 12.5. So we may work with n=12, which is about the lower end of the spectrum cited in the literature of basic reproduction numbers for measles.
Since number of measles cases is Ex/(1-nx), we arrive at the estimate E=300*4%/8%=150.
v=vaccination damage risk/measles damage risk=2:1000
R=150*65/(330 mill.*0.002)=0.0148, which means:
Optimal collective non-vaccination rate is 7.3%.
Optimal individual non-vaccination rate is 8.2%.
Of course these numbers don't have much of a meaning, since they rely on very coarse and insecure estimates and models. Still I doubt that in reality R=70 holds for measles, and rather think that R being smaller than 1 is plausible.
v is the probably that a vaccine causes a severe adverse reaction, which you said is 2 in 1 million. So with your numbers, R should have come out to 14.8
Presumably children who have a severe adverse reaction to a vaccine don’t get a second dose. Presumably children who had no adverse reaction to the first dose are much less likely to have one on the second dose. So it doesn’t make sense to double v for childhood vaccines.
The model just uses N(1-x)/T to estimate the population’s vaccines per year which might cause a reaction, so I don’t see a reason to adjust T down from life expectancy.
Putting it all together, R=150*80/(330M/1M), or about 36 using your more conservative numbers. Not enough of a difference to change the conclusion.